When working in embedded environments, you do not have an operating system and a graphical user interface telling you which memory is filled up. There is no friendly prompt telling you what to remove to free up space. The linker map is basically your local disk properties tab, except everything is in addresses and hexadecimal values.
I ran into this while working with a Parallax Propeller 1
board, Propeller C, and SimpleIDE. My code looked small: a simple LED blink and
an R2U2 runtime verification monitor. The microcontroller had 32 KB of Hub RAM,
but the program was still getting too large. That did not make sense.
|
The confusing part The
monitor object itself was only about 60 bytes. A blinking LED program is
tiny. So why was the whole program acting like it wanted the entire 32 KB
chip? |
Why I Opened the Assembly and Map Files
Before opening the map file, I spent hours rewriting the
code and removing things from the source code to reduce the size. The size
still looked too large for a simple LED blink code with runtime verification.
From my previous work with assembly, I knew that memory
addressing and memory management often become clearer when you look lower than
the C source file. The manual also made it clear that with this chip, manual
memory control is easier to reason about in Spin or assembly than in normal C.
In SimpleIDE Project Manager, I saw a Show Assembly option.
I opened the assembly file first and read through it. That showed me that the
monitor object and my own code were not taking up the amount of space I was
seeing. The monitor was about 60 bytes, and I doubted my LED blink code was
what filled the chip.
The only real outlier was the runtime verification code and
the libraries linked with it. Beside the Show Assembly option, I also saw the
map file option, so I opened the linker map and started looking for the
R2U2/runtime files. That was when the problem became visible.
|
Source code vs. linker map The
source code shows what I wrote. The linker map shows what the compiler and
linker actually brought into the final program. |
What a Memory Map Shows
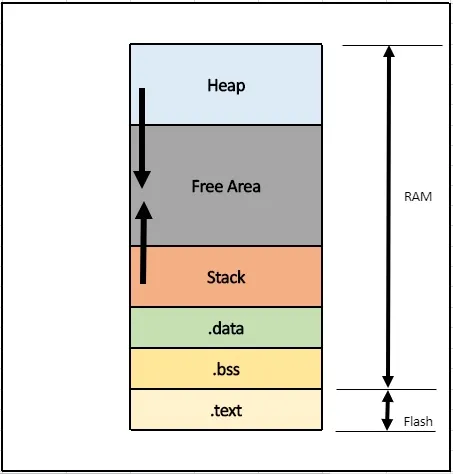
A memory map describes how memory is laid out inside a
system. In an embedded system, it helps show where code, data, stacks, hardware
regions, and libraries are placed. A linker map is the file that shows how the
linker arranged the final executable in those memory regions.
For this Propeller project, the map showed sections such as
code and hub memory, along with the object files that were placed inside them.
The structure I focused on was:
|
Name
Origin Length Attributes |
For debugging memory issues, Length is the most important
part because it tells you how much memory a section or object file is taking.

Figure 1. Part of the generated linker
map showing section names, addresses, and sizes.
The Monitor Was Not the Main Problem
The first thing I checked was whether the R2U2 monitor
object itself was huge. It was not. In the assembly output, the monitor object
was shown as about 60 bytes.

Figure 2. The monitor object shown as 60
bytes in the assembly output.
That was the point where the original assumption stopped
making sense. If the monitor was only about 60 bytes, and the LED blink code
was small, the memory issue had to be coming from something being linked in
with the runtime verification code.
Following the Runtime Libraries
The Propeller documentation warns that printing values can
take stack space and memory. So I searched the linker map for print-related
functions.

Figure 3. Propeller documentation note
about printing values and stack space.
This was also why LED debugging became useful. The test code
itself was not printing anything; it was just blinking LEDs.

Figure 4. The LED test code used for
checking whether the program and cog were running.
Lo and behold, the linker map showed print and scan
functions being pulled in by the runtime verification library. I saw entries
like fprintf, sscanf, float_printf, and float_scanf.

Figure 5. Linker map entries showing
formatted I/O functions such as fprintf, sscanf, float_printf, and float_scanf.
Reading the Size Values
The linker map reports sizes in hexadecimal, so the values
have to be converted before they really make sense. For example, one of the
entries was 0xDE8.
|
0xDE8 = (13 × 256) + (14 × 16) + 8 |
That means one float_printf object alone was over 3 KB. On a
32 KB microcontroller, that is a lot of space. It was more than my actual LED
blink logic and enough to explain why the size was growing so fast.
When I added up just a few of the first object sizes, it was
already around the kilobyte range. For a normal computer, that is nothing. For
this chip, every kilobyte matters.
The Fix
The problem was not the monitor object itself. The problem
was the extra runtime verification libraries and support functions being linked
in. They were added to support the R2U2 runtime, but for the specific
verification test I was running, many of those print and math functions were
not being used.
I picked one object file, found the print and math functions that were pulling in the extra support code, removed the unnecessary dependencies from the R2U2 booleanizer.c file, and rebuilt the project. I also turned off math library support in SimpleIDE for this test.

Figure 6. After editing the
dependency-heavy code, the downloaded size dropped to about 21 KB with math
support still enabled.

Figure 7. With math support turned off
for this test, the downloaded size dropped to 17,564 bytes.
|
Result The
program went from almost filling the 32 KB chip to 17,564 bytes after
removing unnecessary print/math dependencies and disabling math support for
this test. |
Only one object file was edited. The important point is that
the memory issue was not caused by the small LED blink code or the monitor
object. It was caused by the linked R2U2/library code and the support functions
that came with it.
Bonus Discovery: Cog Memory vs Hub Memory
While debugging the memory issue, I also investigated how to
use the Propeller cogs properly. My first assumption was that if I used
cog_run(), the code would move into another cog and therefore use that cog
memory separately.
That was not what happened. cog_run() gives access to
another cog, meaning another processor. But in the Compact Memory Model (CMM),
the code, stack, globals, and R2U2 monitor still mainly use Hub RAM. So it
gives another processor, not a separate 32 KB memory space.
To actually run code from Cog memory, I had to create a
separate .cogc file and start it with cognew(). I tested this with LEDs: the
main CMM program blinked one LED, while the .cogc code turned on another LED.
That confirmed the cog-memory code was running separately.
The Debugging Procedure I Ended Up Using
1. Stop
guessing from the source code alone.
2. Open
the assembly output to check what the code and monitor actually look like.
3. Open
the linker map to see what object files and libraries are being pulled in.
4. Search
for suspicious functions such as printf, scanf, math, or floating-point
helpers.
5. Read
the Length/size values and convert hex to decimal when needed.
6. Remove
or replace dependencies that are not needed for the current embedded test.
7. Rebuild
and compare the downloaded size.
What I Learned
The biggest lesson is that embedded memory problems are not
always caused by the code you wrote directly. Sometimes the real issue is the
support code that gets linked in behind the scenes.
The linker map made the problem visible. Instead of guessing
what was taking space, I could see the object files, the libraries, and their
sizes. It was basically the memory receipt for the whole program.
|
Main takeaway If
a small embedded program suddenly becomes too large, open the linker map. The
problem may be a library dependency, not your main code. |

Comments
Post a Comment